Close Menu
  • Home
  • Budgeting
    • Budgeting Basics
    • Credit & Loans
    • Debt Management
    • Family Budgeting
    • Money-Saving Tips
  • Guides
    • Beginner Finance
    • Financial Independence
    • Side Hustles
    • Taxes
  • Investing
    • Alternative Investments
    • Cryptocurrency
    • Real Estate
    • Retirement
    • Stock Market
  • Saving
    • Coupons and Deals
    • Emergency Funds
    • Frugal Living
    • High-Interest Savings
What's Hot

Bitcoin Breaks Records With 100% Profitable Days And Unmatched Returns

July 13, 2025

The Smarter Web Company Adds 275 BTC To Its Strategic Bitcoin Treasury

July 12, 2025

5 Free Metrics Every Bitcoin Investor Needs

July 12, 2025

Subscribe to Updates

Subscribe to our newsletter and never miss our latest news

Subscribe my Newsletter for New Posts & tips Let's stay updated!

Facebook X (Twitter) Instagram
  • Home
  • About us
  • Advertise with Us
  • Contact us
  • DMCA
  • Privacy Policy
  • Terms & Conditions
Facebook X (Twitter) Instagram Pinterest Vimeo
Clear Finance Guide
  • Home
  • Budgeting
    • Budgeting Basics
    • Credit & Loans
    • Debt Management
    • Family Budgeting
    • Money-Saving Tips
  • Guides
    • Beginner Finance
    • Financial Independence
    • Side Hustles
    • Taxes
  • Investing
    • Alternative Investments
    • Cryptocurrency
    • Real Estate
    • Retirement
    • Stock Market
  • Saving
    • Coupons and Deals
    • Emergency Funds
    • Frugal Living
    • High-Interest Savings
Clear Finance Guide
Home » 5 Free Metrics Every Bitcoin Investor Needs
Investing

5 Free Metrics Every Bitcoin Investor Needs

adminBy adminJuly 12, 2025No Comments4 Mins Read0 Views
Share Facebook Twitter Pinterest LinkedIn Tumblr Email WhatsApp Copy Link
Follow Us
Google News Flipboard Threads
Share
Facebook Twitter LinkedIn Pinterest Email Copy Link


Bitcoin investing can be as straightforward or as complex as you choose. Yet, by utilizing a few free and powerful metrics, investors can gain a considerable edge over the average market participant. These tools, available for free, simplify on-chain analysis and help strip away emotional decision-making.

Realized Cap HODL Waves

The Realized Cap HODL Waves metric is one of the more nuanced tools in the on-chain toolbox. It analyzes the realized price, the average cost basis for all Bitcoin held on the network, and breaks it down by age bands. A significant set of age bands is coins held for three months or less. When this segment dominates the realized cap, it indicates a flood of new capital entering the market, typically driven by retail FOMO. Historical peaks in these younger holdings, often shown in warm colors on the chart, have coincided with major market tops, like those in late 2017 and 2021.
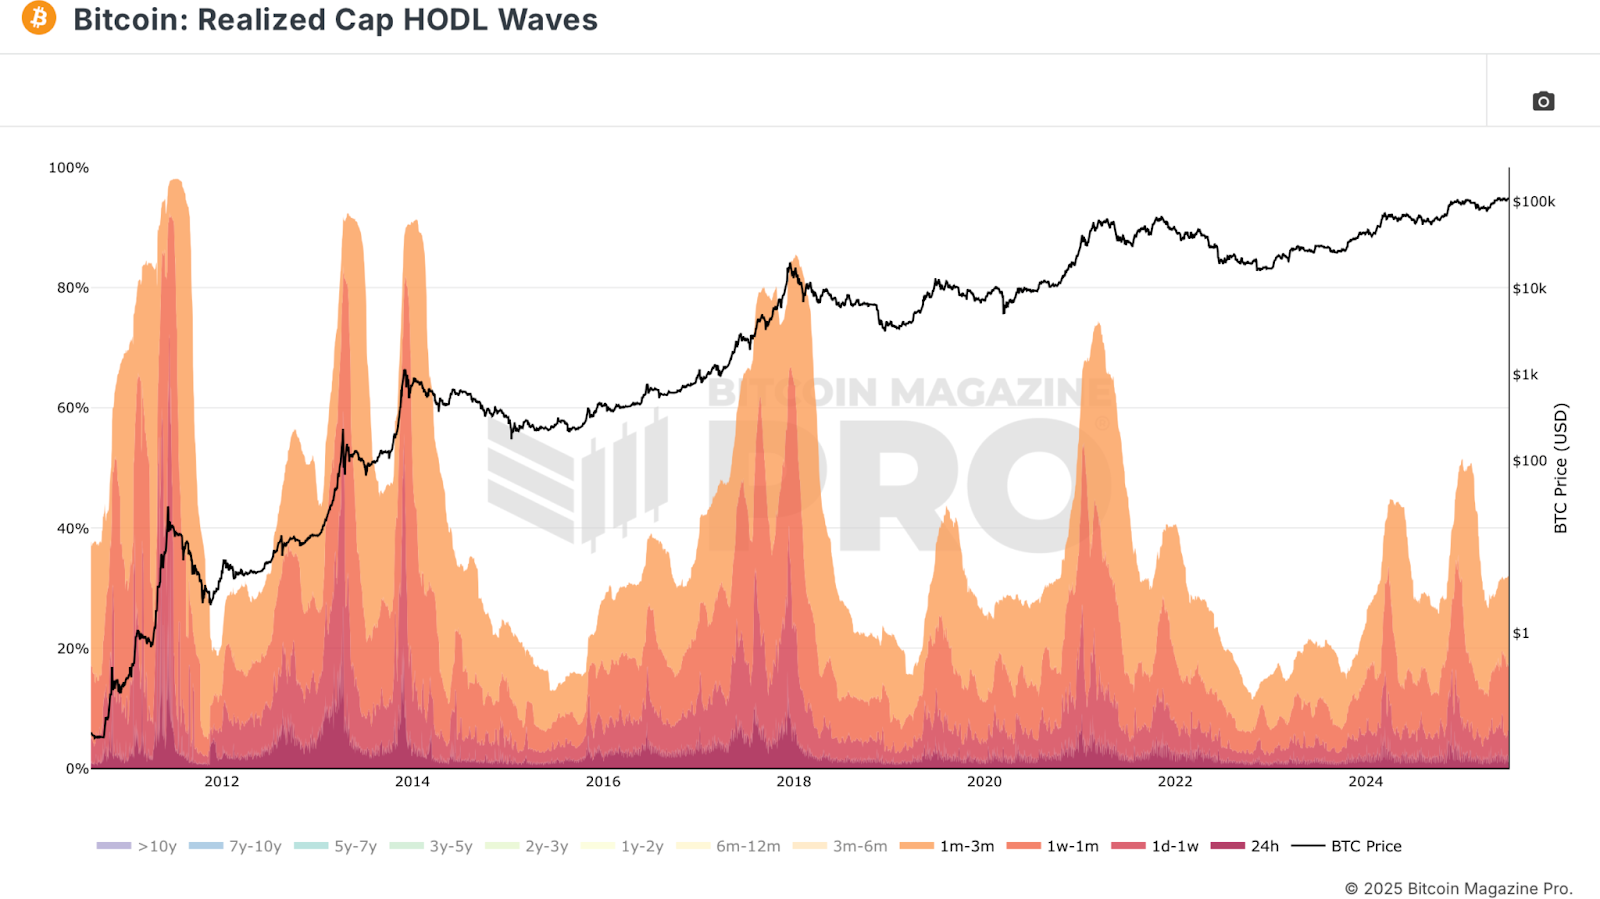
Figure 1: The Realized Cap HODL Waves chart filtered to show recent capital inflows. View Live Chart

Conversely, when the influence of short-term holders diminishes to a low, it generally aligns with bear market bottoms. These are periods when few new buyers are entering, sentiment is bleak, and prices are deeply discounted. This metric can visually reinforce contrarian strategies, buying when others are fearful and selling when greed dominates.

Puell Multiple

The Puell Multiple helps gauge the sentiment of miners by comparing their current daily revenue (in USD) in block rewards and fees against a one-year average. High values indicate miners are extremely profitable, while low values suggest distress, potentially signaling undervaluation.
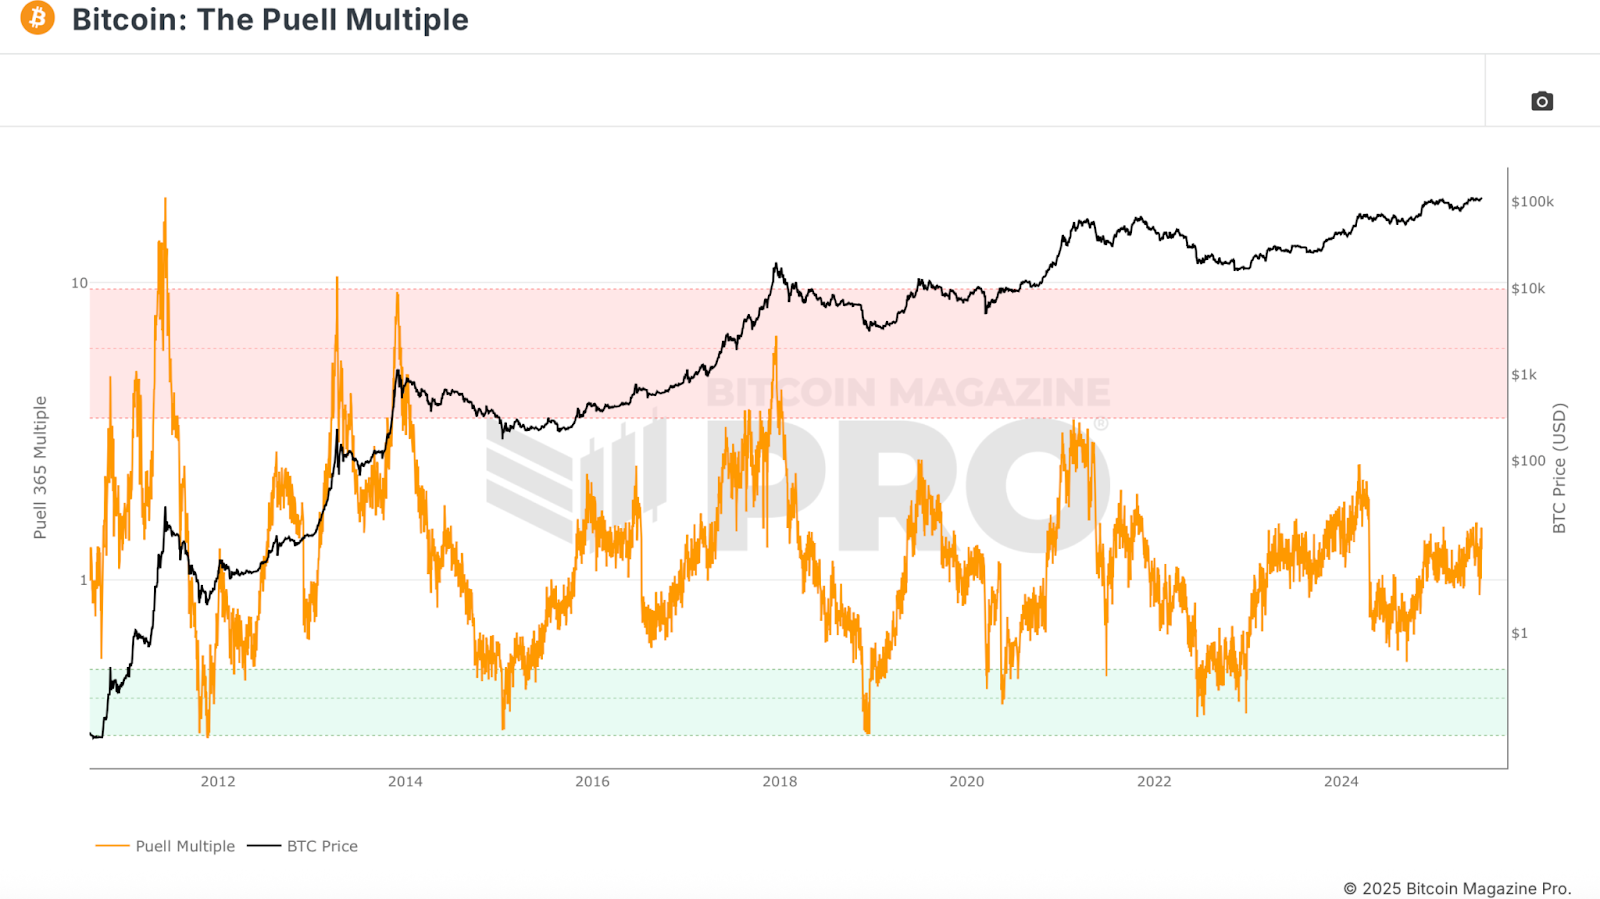
Figure 2: Historically, miners’ sentiment, as captured by the Puell Multiple, has provided reliable cycle top and bottom signals. View Live Chart

During previous cycles, lows in the Puell Multiple have been excellent opportunities for accumulation, as they coincide with times when even miners, with high costs and operational risks, are struggling to remain profitable. This acts as an economic floor and a high-confidence entry signal.

MVRV Z-Score

The MVRV Z-Score is perhaps the most widely recognized metric in the on-chain arsenal. It standardizes the ratio between market value (current price multiplied by the circulating supply) and realized value (average cost basis or realized price), normalizing it across Bitcoin’s volatile history. This z-score identifies extreme market conditions, offering clear signals for tops and bottoms.
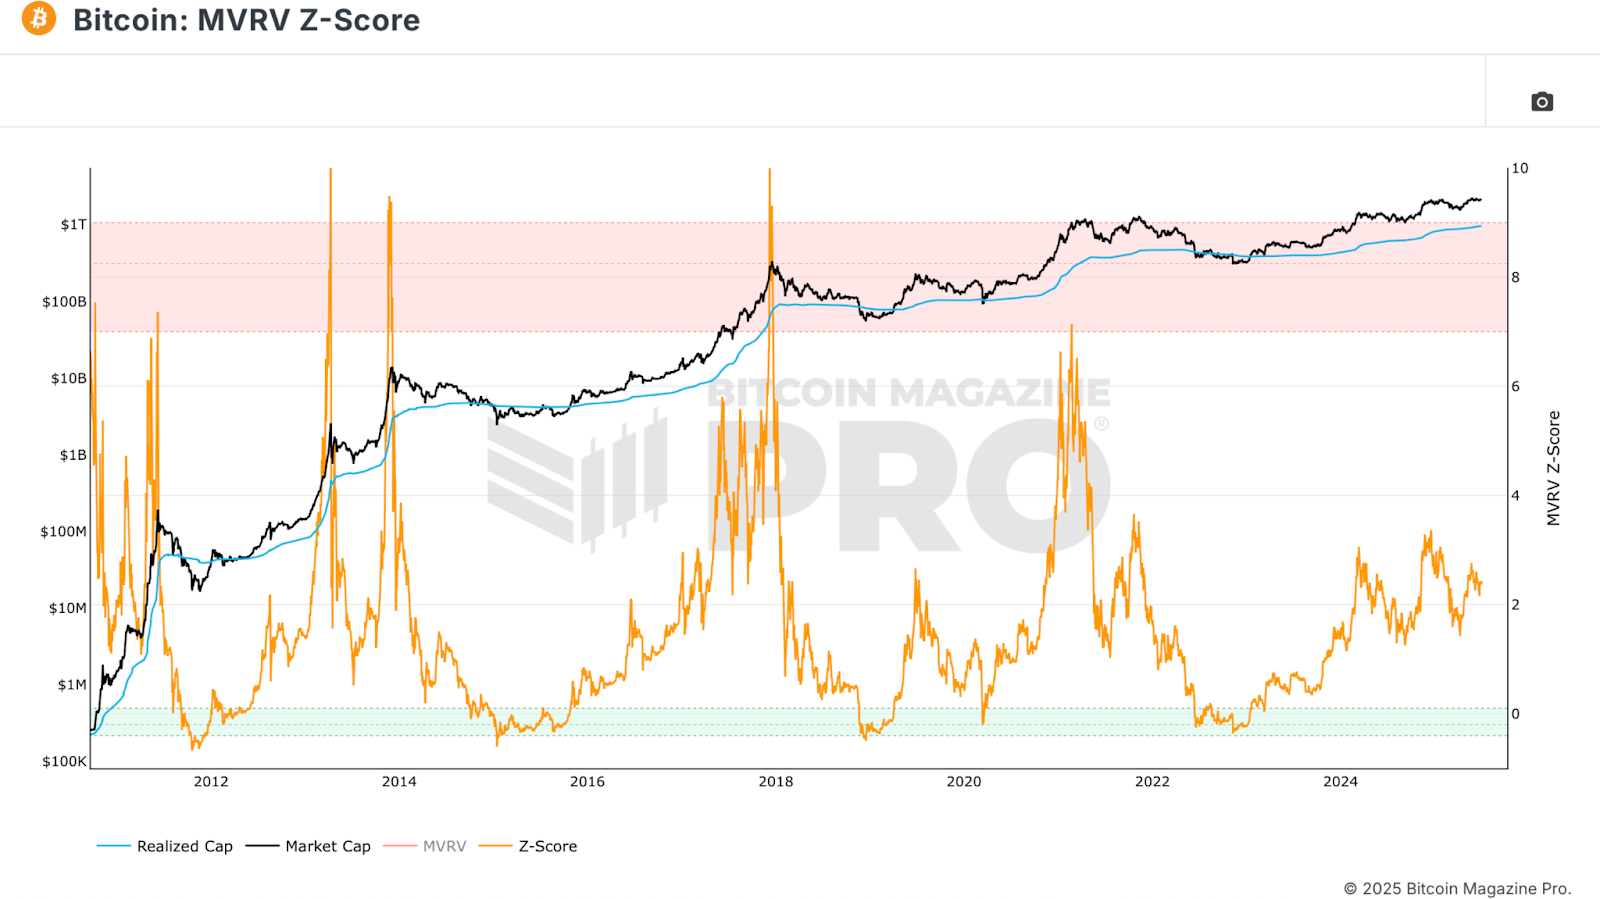
Figure 3: The MVRV Z-Score normalizes data between market value and realized value and has provided accurate insight into market highs and lows. View Live Chart

Historically, a z-score above 7 indicates euphoric market conditions ripe for a local top. A z-score below zero often aligns with the most attractive accumulation periods. Like any metric, it shouldn’t be used in isolation. This metric is extremely effective when paired with some of the others discussed in this analysis for confluence.

Funding Rates

Bitcoin Funding Rates reveal the sentiment of leveraged futures traders. Positive funding means longs are paying shorts, suggesting a bullish bias. Extremely high funding often coincides with euphoria and precedes corrections. Negative funding, conversely, shows fear and can precede sharp rallies.
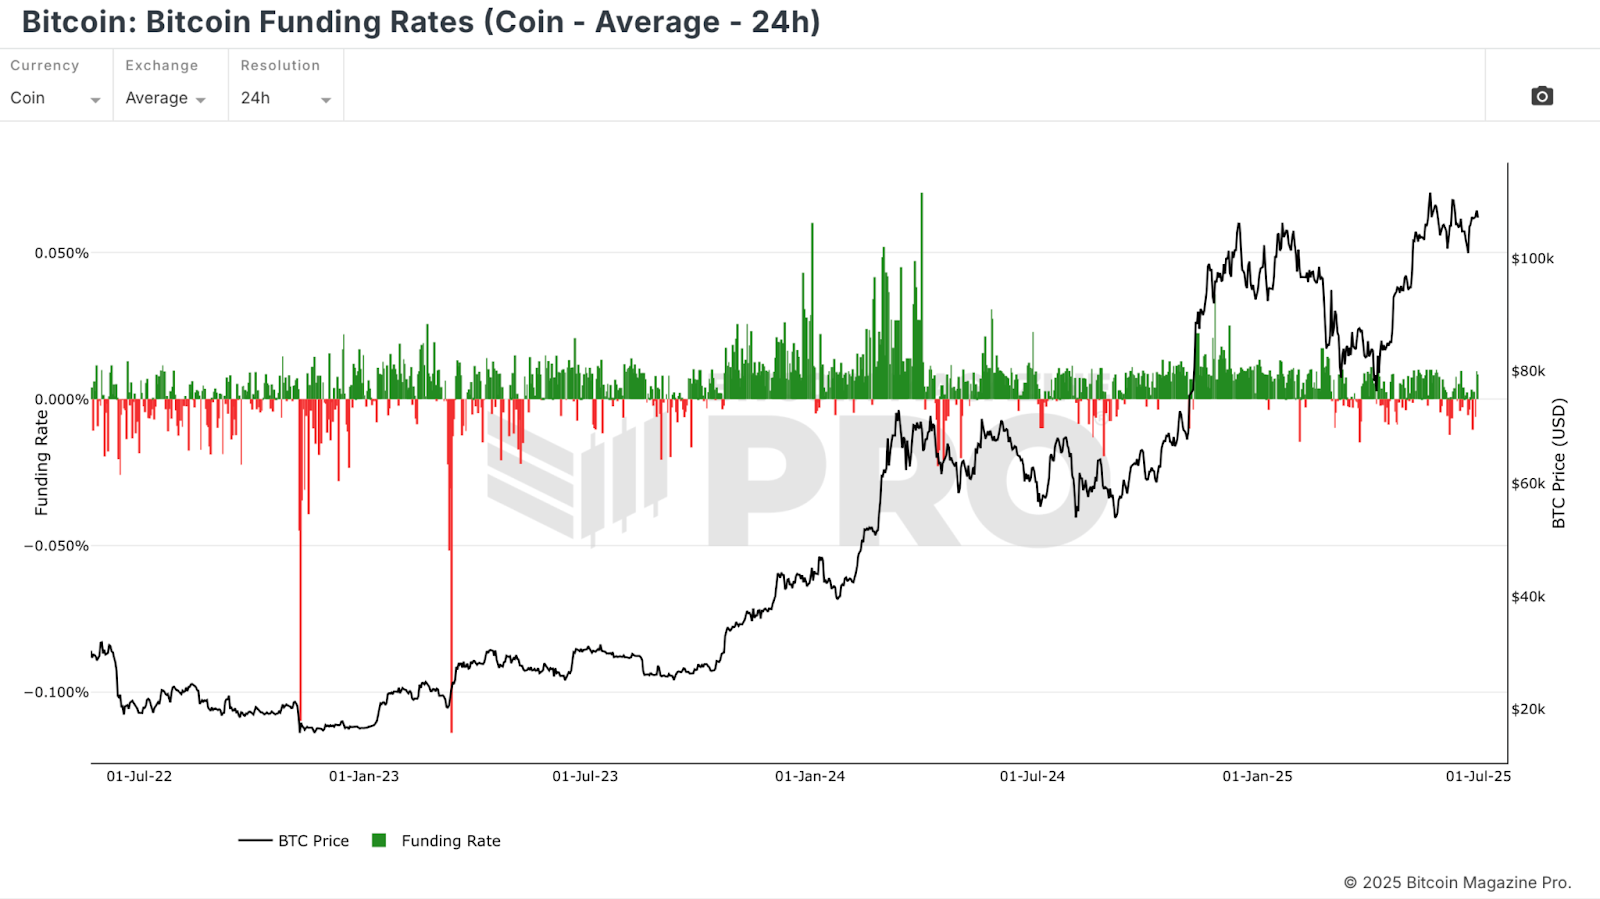
Figure 4: Plotting funding rates to gauge traders’ sentiment and help predict market direction. View Live Chart

Coin-denominated funding rates offer a purer signal than USD pairs, as traders are risking their BTC directly. Spikes in either direction often signal contrarian opportunities, with high rates warning of overheating and low or negative rates hinting at bottoms.

SOPR

The Spent Output Profit Ratio (SOPR) tracks whether coins moved on-chain were in profit or loss at the time of transaction. A reading above zero means the average coin moved was sold in profit; below zero suggests realized losses.
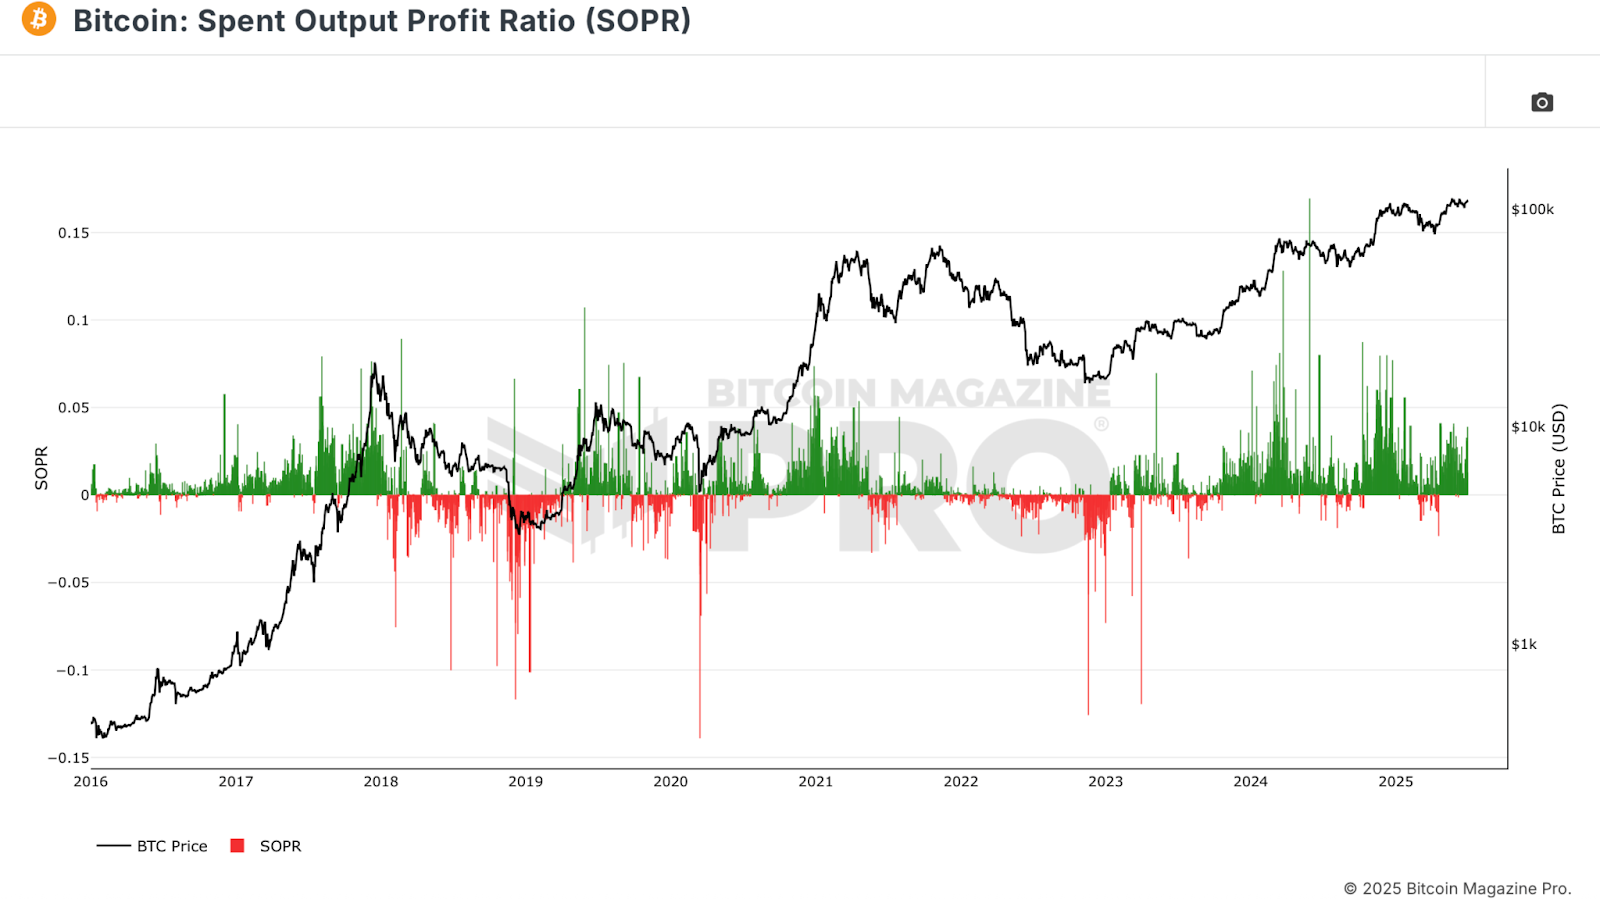
Figure 5: SOPR trends illustrate market sentiment and potentially opportunistic times to accumulate. View Live Chart

Sharp downward spikes indicate capitulation, investors locking in losses. These often mark fear-driven selloffs and major buying opportunities. Sustained SOPR readings above zero can indicate uptrends, but excessive profit-taking may signal overheated markets.

Conclusion

By layering these metrics: Realized Cap HODL Waves, Puell Multiple, MVRV Z-Score, Funding Rates, and SOPR, investors gain a multidimensional view of Bitcoin market conditions. No single indicator offers all the answers, but confluence across several increases the probability of success. Whether you’re accumulating in a bear market or distributing near a potential top, these free tools can help you remove emotion, follow the data, and dramatically improve your edge in the Bitcoin market.

💡 Loved this deep dive into bitcoin price dynamics? Subscribe to Bitcoin Magazine Pro on YouTube for more expert market insights and analysis!


For more deep-dive research, technical indicators, real-time market alerts, and access to expert analysis, visit BitcoinMagazinePro.com.


Bitcoin Magazine Pro

Disclaimer: This article is for informational purposes only and should not be considered financial advice. Always do your own research before making any investment decisions.



Source link

Share. Facebook Twitter Pinterest LinkedIn Tumblr Email WhatsApp Copy Link
admin
  • Website

Related Posts

Investing

Bitcoin Breaks Records With 100% Profitable Days And Unmatched Returns

July 13, 2025
Investing

The Smarter Web Company Adds 275 BTC To Its Strategic Bitcoin Treasury

July 12, 2025
Investing

Takeaways From The Final Tornado Cash Status Conference Hearing

July 12, 2025
Investing

Bitcoin Breaks $118,000—But Liquidity Still Thin, Glassnode Warns

July 11, 2025
Investing

Rumble Partners With MoonPay To Launch Bitcoin Wallet For Creators

July 11, 2025
Investing

Bitcoin Hits New All Time High Of $113,900 As Adoption Accelerates

July 11, 2025
Add A Comment
Leave A Reply Cancel Reply

Editors Picks

Credit Card Loans Hit Record High Amid Tightened Bank Lending and Sluggish Consumption

November 21, 2024

How family firms could be affected by Budget tax rises

November 21, 2024

Recreation District budgets for potential November ’25 ballot question for pool operations – Canon City Daily Record

November 21, 2024

UK Digital Gilt won’t be issued via Debt Management Office. Does it matter? – Ledger Insights

November 21, 2024
Latest Posts

How to save money on your energy bill this winter

November 21, 2024

Building Wealth Is a Journey – Don’t Rush the Process | Newsradio WOOD 1300 and 106.9 FM

November 21, 2024

Regulators Tell Committee They’ll Pause New Banking Rules

November 20, 2024

Subscribe to Updates

Subscribe to our newsletter and never miss our latest news

Subscribe my Newsletter for New Posts & tips Let's stay updated!

About Us
About Us

Welcome to ClearFinanceGuide, your trusted resource for navigating the world of personal finance and investment! Whether you’re just starting out on your financial journey or looking to optimize your wealth-building strategies, we are here to provide clear, actionable advice to help you make informed financial decisions.

Facebook X (Twitter) Pinterest YouTube WhatsApp
Most Popular

Is Traditional Real Estate Investing a Dying Breed? How Fractional Ownership is The New Investing Wave

November 9, 20240 Views

FTX sues Scaramucci to recoup money put into showy investments

November 10, 20240 Views

Warren Buffett Recommends Most Investors Buy This 1 Index Fund — and It Could Turn $200 per Month Into $227,000 or More

November 10, 20240 Views

Subscribe to Updates

Subscribe to our newsletter and never miss our latest news

Subscribe my Newsletter for New Posts & tips Let's stay updated!

© 2025 clearfinanceguide. Designed by clearfinanceguide.
  • Home
  • About us
  • Advertise with Us
  • Contact us
  • DMCA
  • Privacy Policy
  • Terms & Conditions

Type above and press Enter to search. Press Esc to cancel.